Materials Mechanics
Monocular 3D Video Extensometer



Monocular 2D Optical Strain Measurement System
Monocular 3D Optical Strain Measurement System
High-Speed Monocular 3D Optical Strain Measurement System
Stereo 3D Optical Strain Measurement System
Optical Strain Measurement System – Educational Edition
2D Optical Microscopic Strain Measurement System


Strain Measurement of Parallel Lap Welds
Residual Deformation Measurement of Drilled Welded Plates
Full-Field Strain Measurement of Weldments in Compression
Tensile Deformation Measurement of 0.3mm Fiber Filament
Unmarked Compression Deformation Measurement of Composite Materials

Deformation Measurement of Artificial Cardiac Patch
Keycap Vibration Measurement: Quantifying Press and Rebound Dynamics
Headband Deformation Measurement: Analyzing Bending Position and Unloading Recovery
High-Temperature DIC Measurement of Wafer Thermal Warpage: Quantifying Warpage vs. Temperature
UAV Dynamic Tracking Measurement: Capturing Flight Trajectory and Attitude Changes

 0755-86347753

Published: 2026-06-01
The visual crack gauge is a device that performs non-contact automatic monitoring of structural crack width through image acquisition and DIC (digital image correlation) algorithms, mainly used for online crack monitoring and long-term tracking of bridges, tunnels, dams, buildings, slopes and other structures. While collecting crack width data, the Haytham visual crack gauge synchronously saves site images and returns them in real time to the cloud platform via 4G wireless network, achieving structural health monitoring with visible results, traceable processes and provable anomalies.
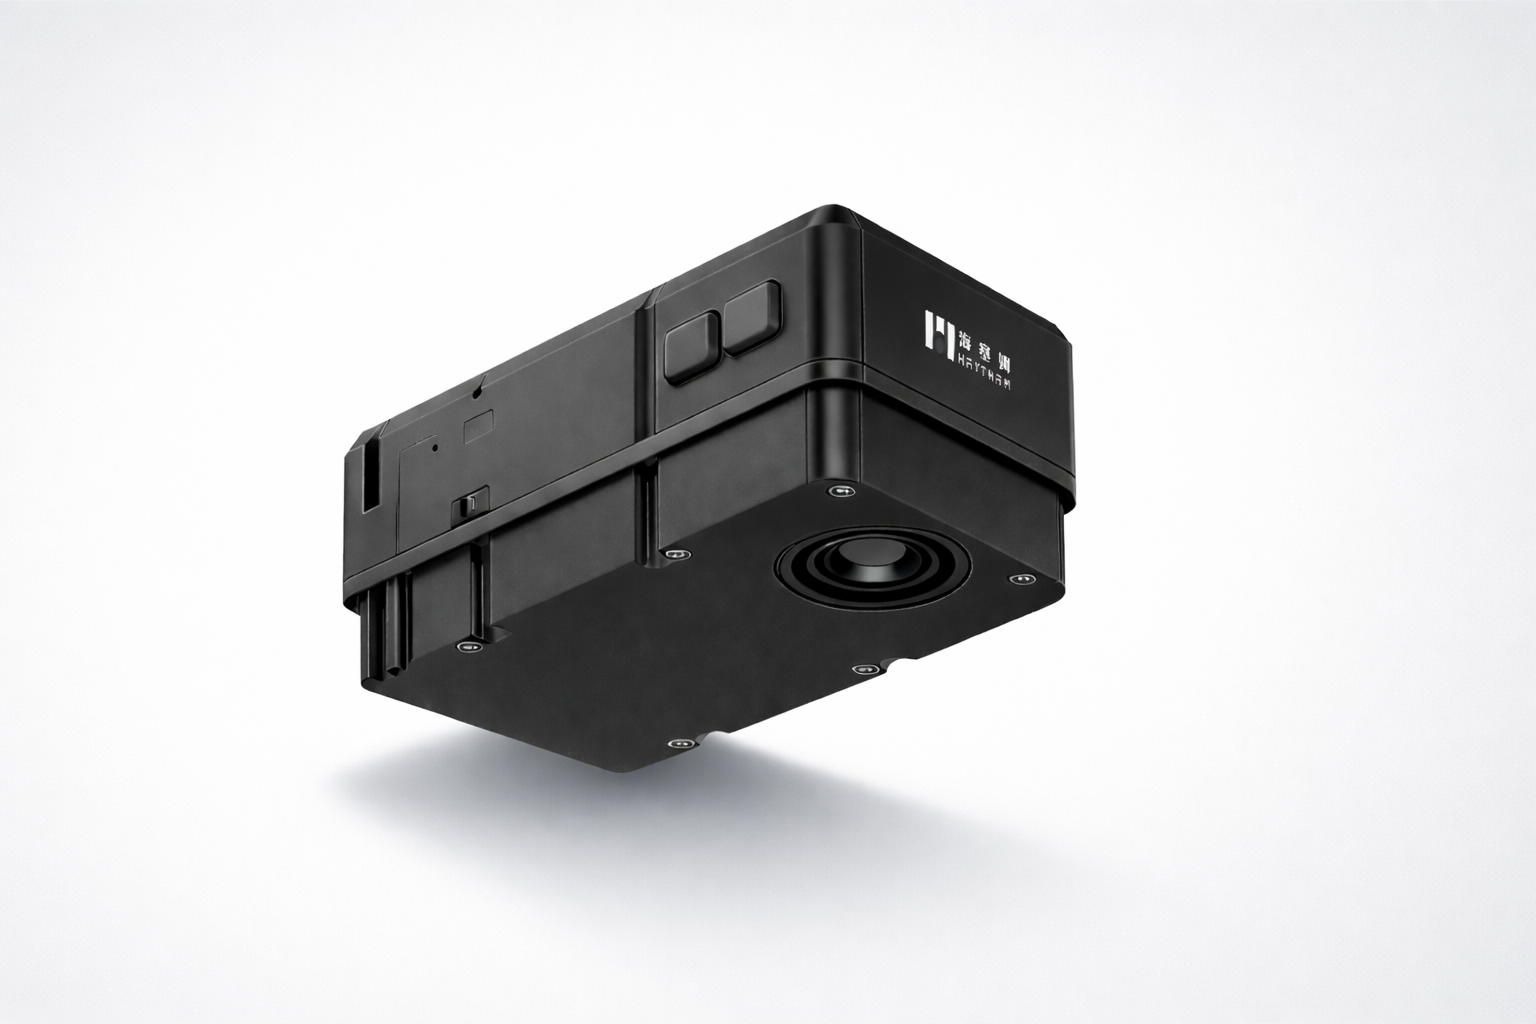
visual crack gauge is an automatic crack width measurement device based on machine vision and DIC algorithms, with core features including:
▪ Non-contact measurement: no cross-crack bonding or mechanical connection needed; width is computed by capturing crack images through the lens;
▪ Dual output of images and data: each monitoring data record corresponds to a reviewable site photo;
▪ Remote online monitoring: supports 4G and other wireless networks, returning data to the cloud platform in real time;
▪ Long-term unattended operation: one installation enables continuous monitoring from months to years.
Compared with traditional vibrating-wire, resistance and displacement-meter crack gauges,The visual crack gauge better suits structural safety monitoring scenarios that need an evidence chain, such as load-bearing evaluation of existing bridges, dangerous building screening and reinforcement effect verification.
The workflow of the Haytham visual crack gauge can be divided into four steps:
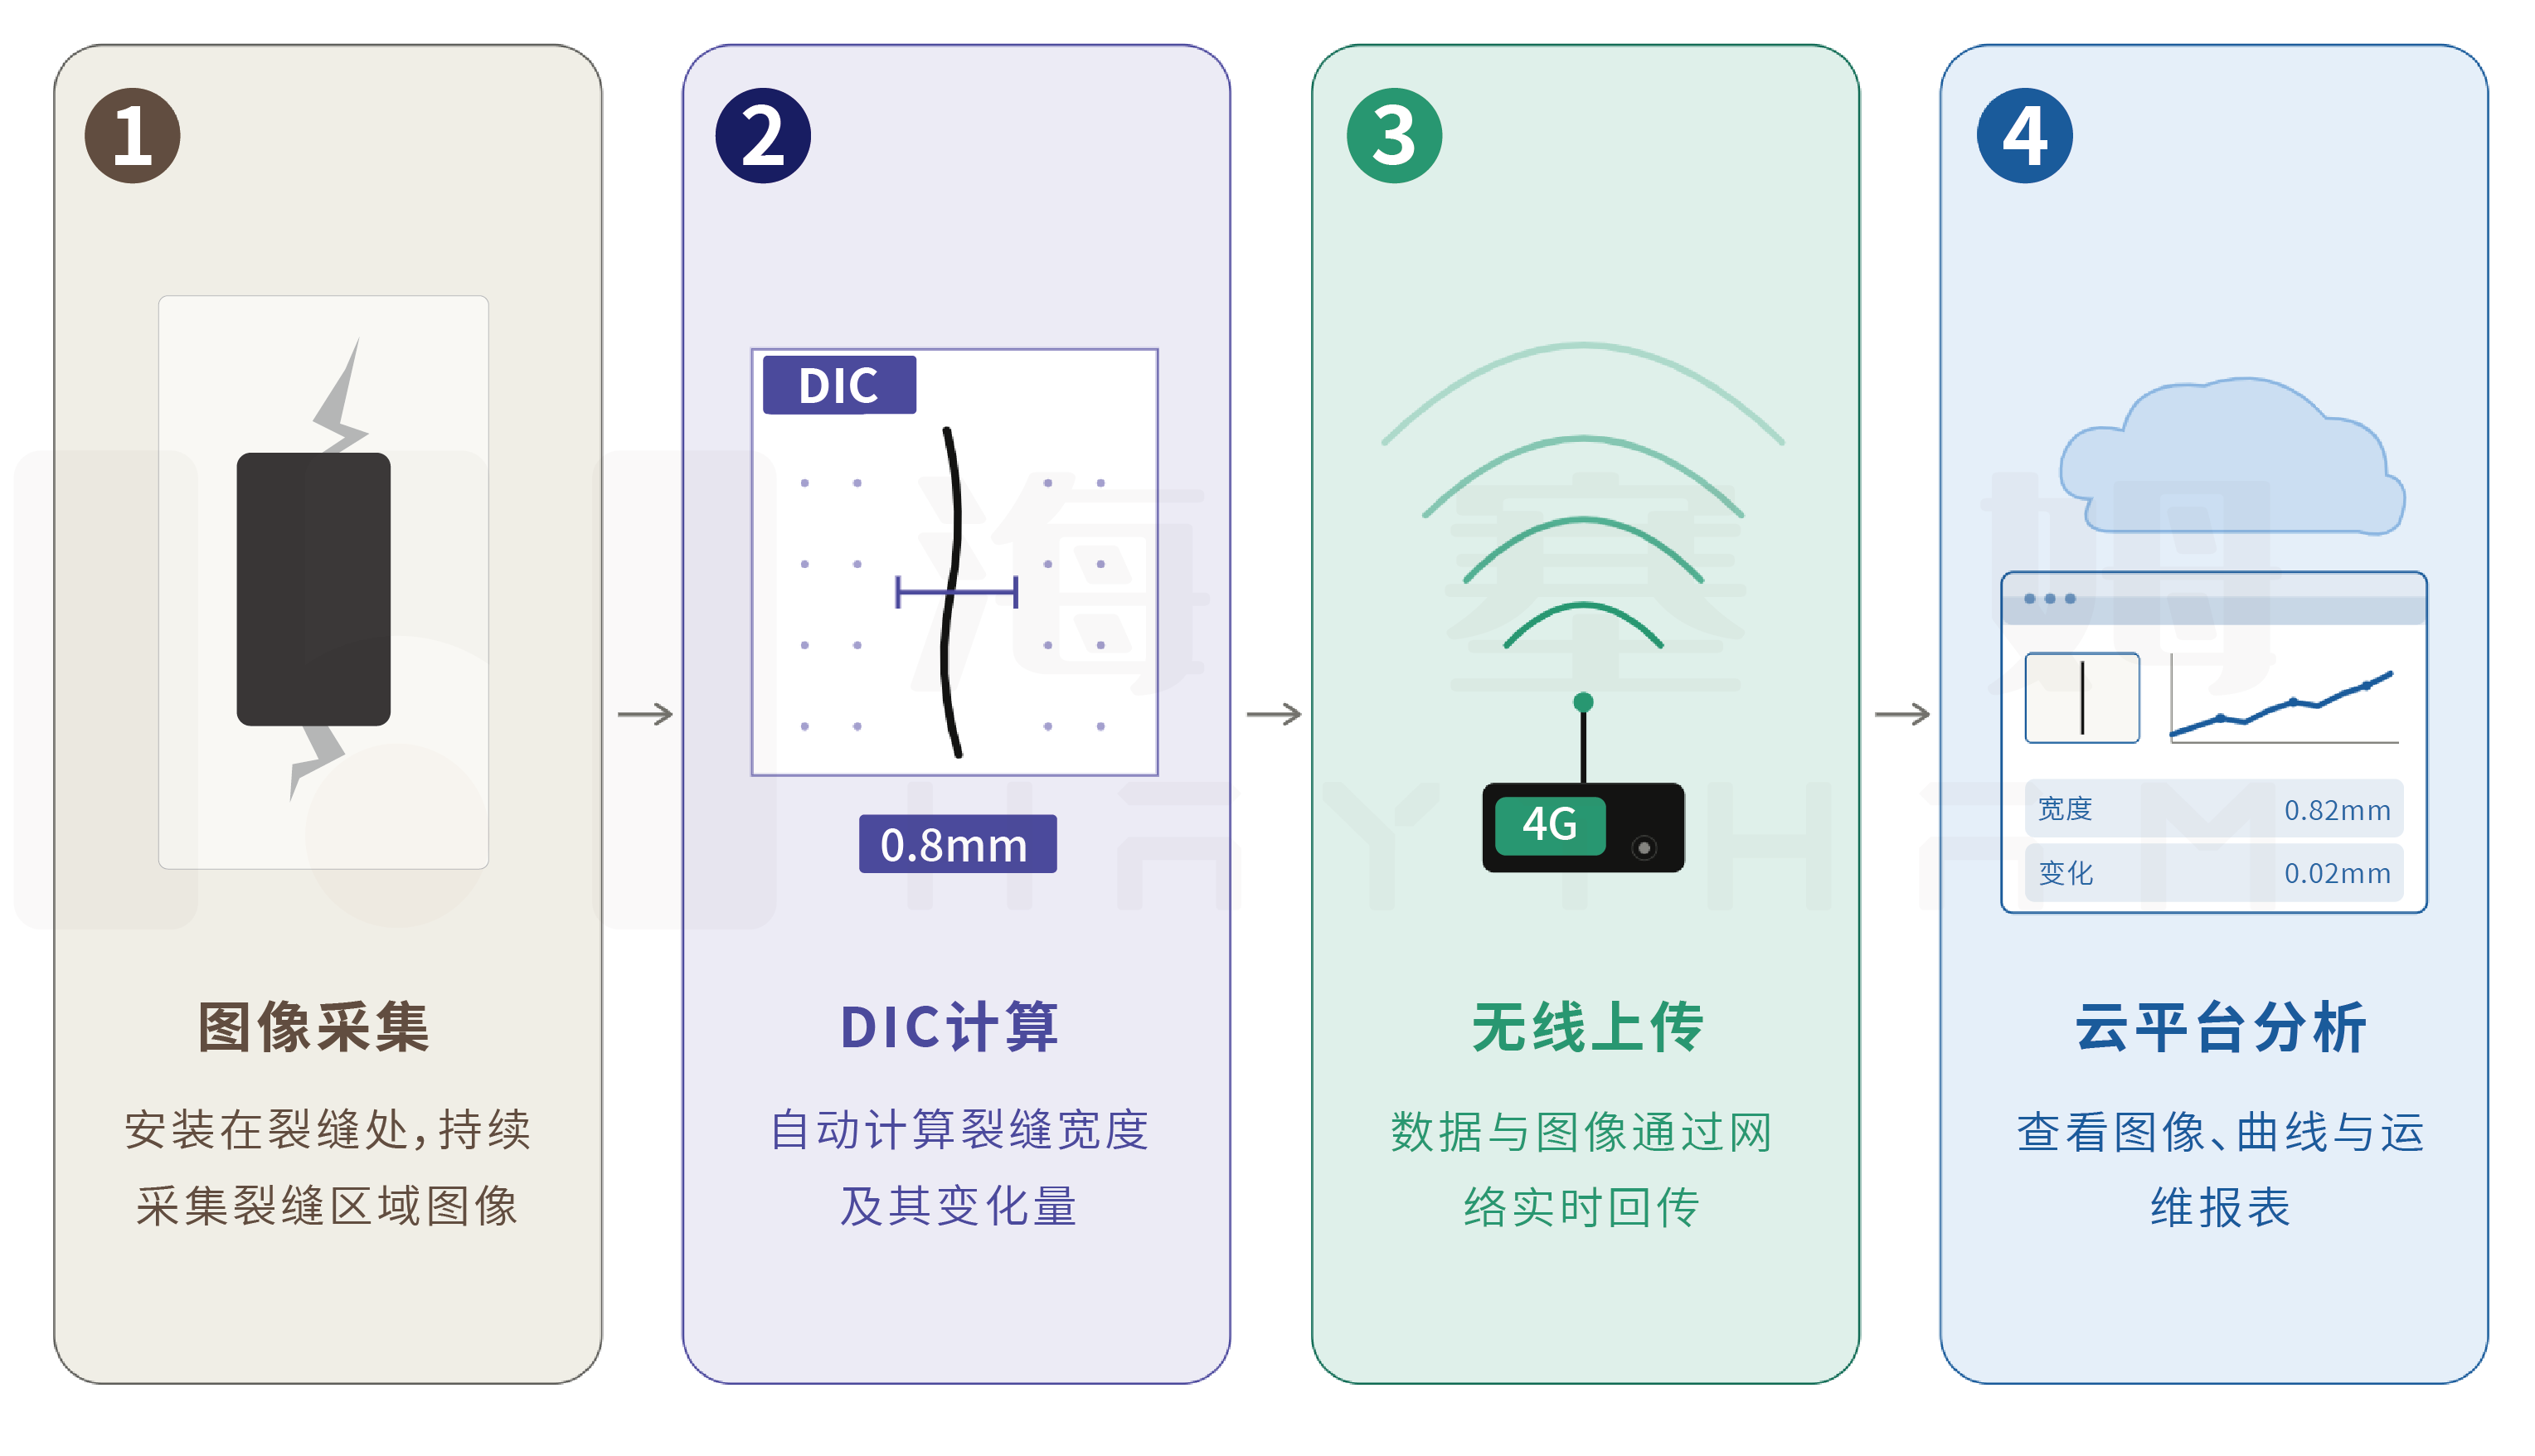
▪ The image acquisition device is installed above the crack location, with a built-in high-resolution image sensor and a lens facing the crack, continuously capturing images of the crack area.
▪ DIC algorithm computes crack width: DIC (Digital Image Correlation) technology tracks the relative displacement of speckle or texture features in images, achieving sub-pixel displacement and width measurement, automatically outputting crack width and its changes.
▪ 4G wireless upload: monitoring data and site images are uploaded to the cloud platform in real time via the 4G network, with no on-site wiring or manual data retrieval.
▪ Cloud platform viewing and analysis: the platform automatically forms trend curves and O&M reports, and supports synchronized comparison of initial images, current images and change curves.
The fundamental difference between the visual crack gauge and traditional contact crack gauges lies in the measurement method. Traditional contact crack gauges (displacement-meter type, vibrating-wire type, resistance strain type) obtain the relative displacement across both sides of the crack through physical cross-crack sensing, essentially measuring the distance change between two anchor points; the visual crack gauge, based on DIC digital image correlation technology, captures images of the crack area and tracks the relative displacement of feature positions in the images to achieve non-contact width measurement. The former relies on contact, the latter on seeing.
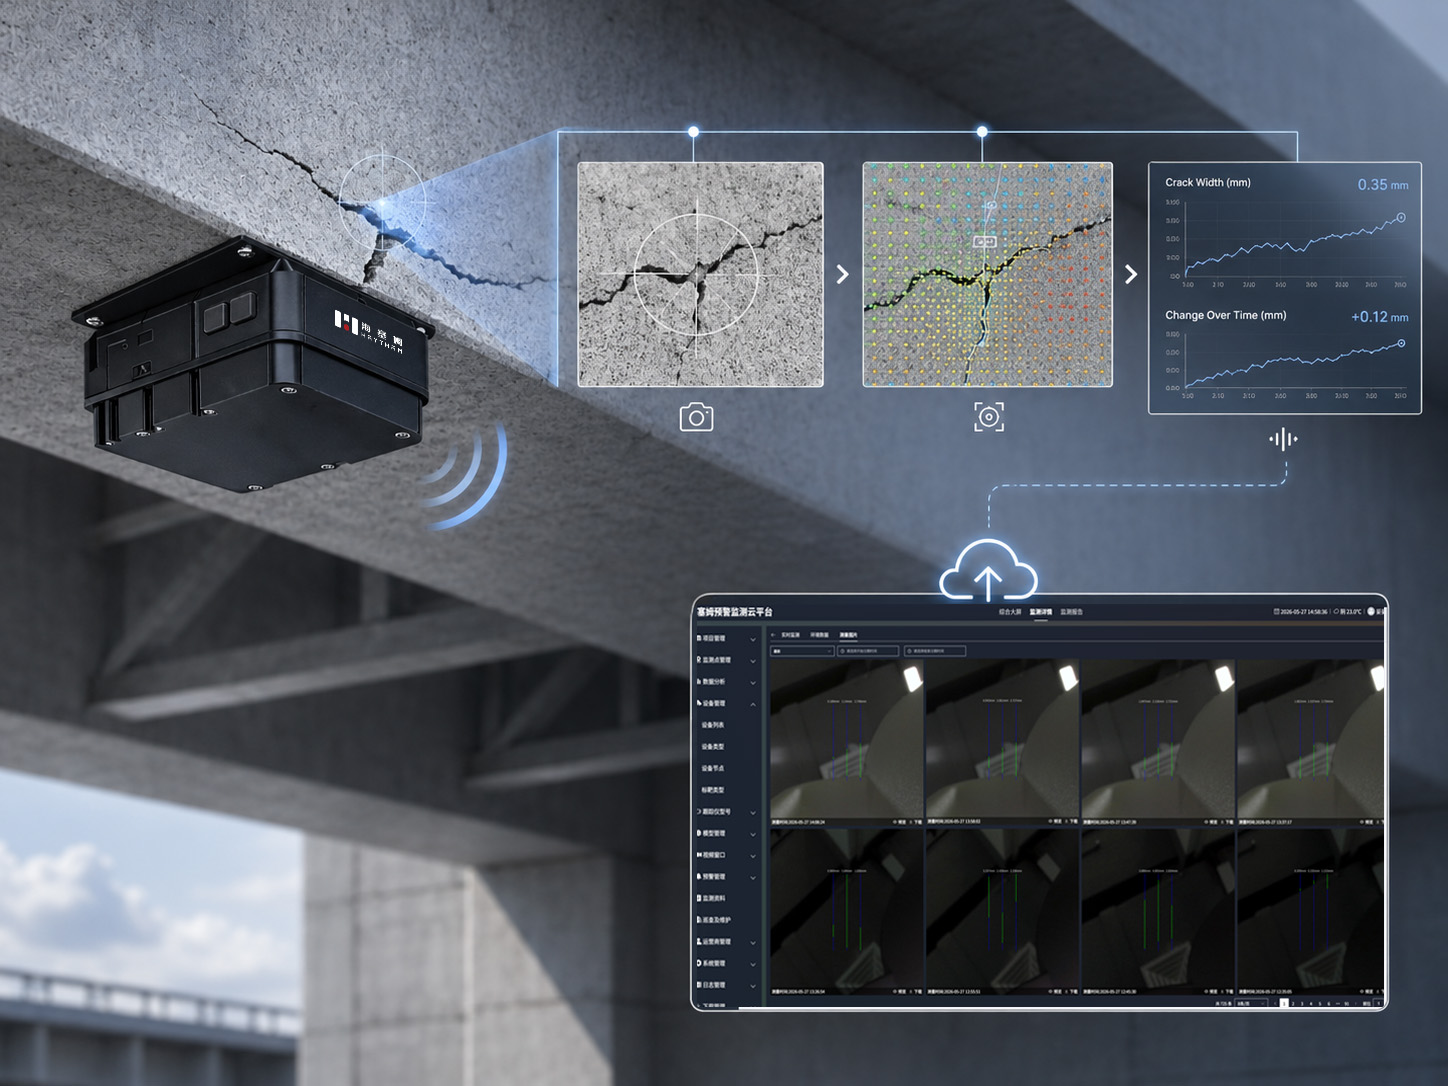
In output content, this is where the two differ most. Contact crack gauges output a single numeric value — how many millimeters the crack width changed at a certain moment. The Haytham visual crack gauge outputs data and images in parallel: behind every data point is a site photo taken at the same moment. This means the platform can show not only the width change curve but also retrieve the initial and current images for comparison; O&M personnel see no longer just numbers, but the crack itself.
The resulting difference shows in anomaly verification. When the data of a contact crack gauge suddenly jumps, O&M personnel usually cannot judge whether it is real crack propagation, temperature disturbance, sensor drift or loose installation; they often need to send people to verify on site, increasing cost and delaying judgment.
visual crack gaugeOn the cloud platform, site images and timestamps before and after the jump can be viewed synchronously; combined with environmental photos and curve changes, O&M personnel can quickly judge the nature of the anomaly remotely without rushing to the site.
▪ From point records to continuous tracking
Measurement frequency can be flexibly set per project: high-frequency acquisition in critical periods, appropriately reduced frequency in stable stages. Data is automatically summarized into trend curves and O&M reports, so the crack development process no longer stays in scattered manual records.
▪ From looking at data to looking at evidence
The platform synchronously displays the initial image, current image and change curves. When a sudden jump appears, O&M personnel can immediately retrieve the before/after images to judge whether it is temperature influence, load disturbance or abnormal equipment status, significantly shortening review time.
▪ From human-inspected equipment to equipment standing watch
Integrated design with no cross-crack connection; long-term monitoring starts once fixed. For scenarios hard for manual inspection to cover — night, high altitude, rain, confined spaces — the device returns data and images 7×24 hours non-stop.
▪ bridge crack monitoring
Long-term tracking of box girder web cracks
Pier column crack monitoring
Load-bearing capacity evaluation of existing bridges
reinforcement effect verification
▪ Tunnel crack monitoring
Secondary lining circumferential and longitudinal cracks
Construction joint change monitoring
Crack response under train loads and surrounding rock pressure
▪ Building and foundation pit monitoring
Crack change monitoring of existing buildings
Protection of buildings around foundation pits
Safety screening and evidence chain retention for dangerous buildings
▪ Other infrastructure
Long-term observation of temperature cracks on the downstream face of a dam
Crack monitoring for roads, slopes and retaining walls
Structural safety monitoring for rail transit
Structural monitoring of industrial plants and warehouses





 Downloads

